Analysis: African Americans hit hardest on homeownership
Editor's note: Bridge presents, from time to time, comments from Kurt Metzger of Data Driven Detroit on what the 2010 census results mean for Michigan today, and tomorrow. Metzger worked for the U.S. Census Bureau for 15 years and has been studying demographic data and issues in Michigan for three decades.
Homeownership was humming nationally during the first half of the first decade of the 21st century. Housing values were rising at record rates and banks and mortgage companies were making loans to almost anyone with a pulse. This began to change in late 2007 as the term "foreclosure" emerged from obscurity and began to dominate the front pages of newspapers.
Michigan, with an economy that had been in the doldrums for years already, was thrown on to the "foreclosure bandwagon." Monthly releases from RealtyTrac had Michigan and metro Detroit either leading the pack or in the top three on foreclosure rates. The combination of economic forces began to drive the overall housing and property values down across the state -- leading to economic crises for both residents and local governments. The

Standard and Poor's/Case Shiller Home Price Index estimates that housing values in the Detroit metropolitan area (the only Michigan area measured) decreased, as of December 2010, to 68 percent of their January 2010 values.
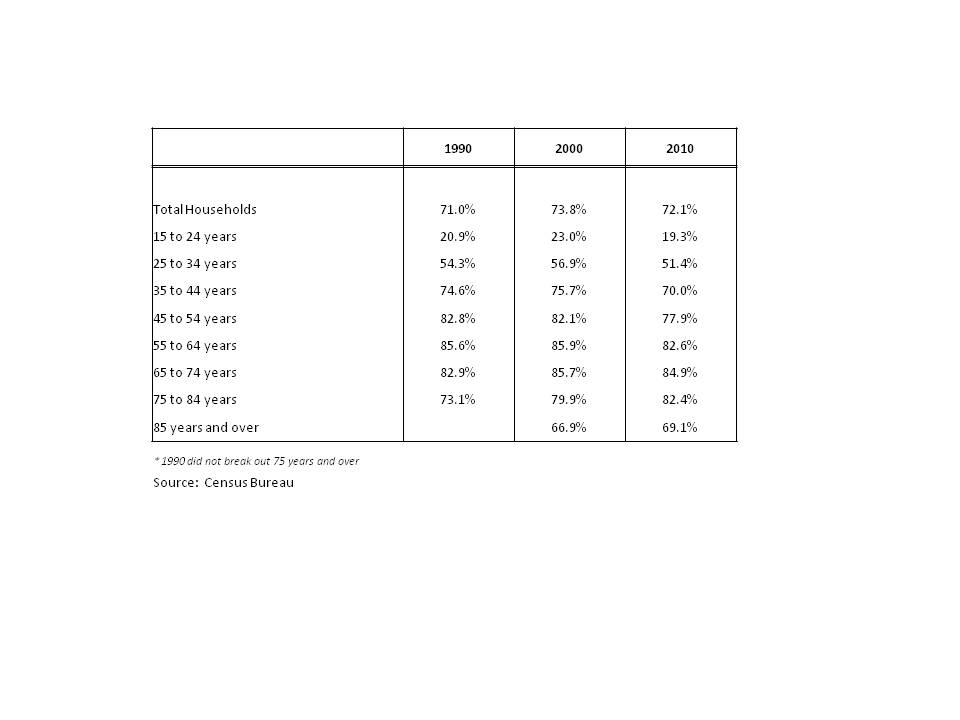
Obviously, lost jobs, foreclosures and decreasing home values have changed the picture of homeownership inMichigan. While the overall ownership rate increased between 1990 and 2000, from 71 percent to 73.8 percent, it fell back to 72.1 percent in 2010.
Let us first take a look what has happened to ownership rates by the age of the householder.
The first thing that jumps out is homeownership rates increase with age, with the highest rate for persons 65-74 years of age. When we look at the 2000-2010 trend, we see that all age groups, with the exception of those 75 years and over, took a hit over the decade.
The largest drops hit the core working-age groups -- 25-34 years, 35-44 years and 45-54 years. This is extremely troublesome as it indicates that economic troubles for the younger folks we want to attract and retain (25-34 years) may make them more apt to move away.
Table 1: Homeownership Rates in Michigan by Age of Householder, 1990-2010
Another trend that appears to be occurring nationally is a tendency for this age group to return to their parents' homes in increasing numbers. Does this portend a generation with lower levels of wealth attainment?
The next two age cohorts (35-44 and 45-54) should be in their prime working years, when asset building is in full swing. And housing always has been the prime source of asset development. Do these losses portend economic difficulties as these groups age into retirement?
While ownership rates are still high, we also see the rates have decreased for those groups approaching retirement or newly entering retirement (if decreasing home values and retirement savings have not kept them in the labor force). How will this affect the potential for living out a comfortable retirement?
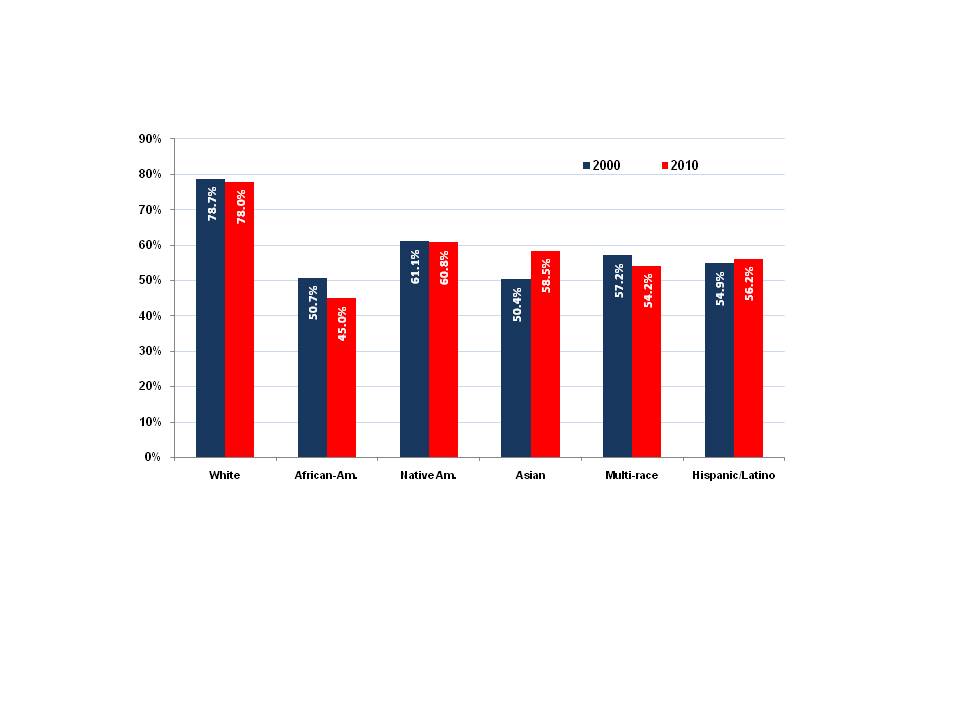
So many stories tied to the foreclosure crisis spoke to the federal government's efforts at making homeownership more possible for low-income persons and persons of color, and the resultant crisis driven by the subprime mortgage market that developed around these initiatives. This, combined with job losses and high mortgage payments on mortgages higher than the decreased value of the home, has had a devastating effect on the African-American community in particular. Figure 1 shows Michigan homeownership rates by race and ethnicity between 2000 and 2010.
Figure 1: Homeownership Rates in Michigan by Race/Ethnicity of Householder, 2000-2010
It is quite clear that African Americans took the brunt of the loss inMichigan, as their homeownership rate dropped from 50.7 percent in 2000 to 45 percent in 2010. The white population, Native Americans and multi-race respondents all experienced small losses over the decade.
The winners, by contrast, were Latinos, many of whom did not utilize traditional banks and mortgage companies for their homes (often paying cash or assuming land contracts), and the Asian population, which showed an increase of eight percentage points! I attribute this result to the high educational attainment in the Asian population, which results in higher-paying jobs that were not affected as much by the economic downturn. (Asian households showed the smallest loss in buying power over the decade.) Also, there's the tendency for Asian households to have multiple workers, thus ensuring a higher, and more stable, household income.
While married couple households took a slight hit (89 percent to 88.4 percent), families headed by single females experienced the largest drop, falling from 57.5 percent to 53.2 percent. Families headed by single men dropped from 66.6 percent to 64.5 percent. The only gainers were males living alone, particularly those 35-64 years of age, and non-family households of two or more persons.
As 2011 reaches fall, we are inundated with economic news. Much of it continues to be rather depressing, though there are "points of light," to quote a former president. While these lights are flickering, at least they are on periodically. Let us hope that their glow can finally be stabilized so that growth can follow in the not- too-distant future.
Business Watch
Covering the intersection of business and policy, and informing Michigan employers and workers on the long road back from coronavirus.
- About Business Watch
- Subscribe
- Share tips and questions with Bridge Business Editor Paula Gardner
Thanks to our Business Watch sponsors.
Support Bridge's nonprofit civic journalism. Donate today.
See what new members are saying about why they donated to Bridge Michigan:
- “In order for this information to be accurate and unbiased it must be underwritten by its readers, not by special interests.” - Larry S.
- “Not many other media sources report on the topics Bridge does.” - Susan B.
- “Your journalism is outstanding and rare these days.” - Mark S.
If you want to ensure the future of nonpartisan, nonprofit Michigan journalism, please become a member today. You, too, will be asked why you donated and maybe we'll feature your quote next time!