Another income report is out, and the news is not so good for Michigan
Last time, I reported on the good news coming out of the latest Census Bureau report: median household income increased and poverty decreased for Michigan between 2010 and 2011. These data points were based on the results of the Current Population Survey (CPS) Annual Social and Income Supplement, conducted in March of each year.
We now have more data – this time the results of the 2011 American Community Survey (ACS) that were released on Sept. 20. The one-year version of ACS for 2011 (states, counties and communities of 65,000 population or more) provides a picture that is the reverse of CPS – median household income fell and poverty increased.
As with beauty, survey results are dependent upon the "eye" – methodology, time-frame covered, question wording, etc. – through which you view them.
Michigan’s median household income was found to have decreased 1.5 percent between 2010 and 2011, dropping from an adjusted $46,692 in 2010 to $45,981. This represented a statistically significant decline. Michigan income has declined by 11.5 percent since the 2007 ACS was conducted, and 27.3 percent since 1999 (data collected in the 2000 Census).

Michigan’s ranking was 35th in 2011, a drop of one spot from its 2007 rank of 34th (see Table 1). The effects of the housing crisis and rising unemployment are clear in the results for Nevada, as income fell by 18.1 percent over the four-year period and its ranking dropped from 20th to 28th place. The second-largest decrease occurred in Florida.
Figure 1 illustrates the trend, by income category, that has resulted in Michigan’s decrease. The categories have been adjusted to reflect 2011 dollars and make it quite clear that the growth has concentrated in each of the income categories below $35,000. In 2007, 33.7 percent of all Michigan households had incomes less than $35,000. By 2011, this share had grown to 38.8 percent.
Michigan’s overall poverty rate was reported as taking a statistically significant jump from 16.8 percent to 17.5 percent between 2010 and 2011. The poverty rate measured by the 2007 ACS was 14 percent. If we were to look back at the 2000 Census results, we would find that the 2011 share was 67 percent higher than the 1999 rate of 10.5 percent. Michigan tied with Oregon for 15th highest poverty rate in the nation. The highest was Mississippi’s 22.6 percent, while the lowest was New Hampshire’s 8.8 percent.
Table 1. Median Household Income for States, 2007 – 2011
Figure 1. Michigan Household Income Distribution, 2007-2011 (in 2011 dollars)
The poverty rate for related children under 18 years of age has risen from 13.4 percent in 1999 to 24.4 percent in 2011, representing an increase of 82.1 percent.
An income measure that always causes a stir is the ratio of male to female full-time, year-round workers. This is often referred to as the "77 cents on the dollar rule," demonstrating that women are not paid at the same rate as men. While there are a number of caveats tied to this overall number – it is not weighted by specific occupation or years of experience – it is an indication how the various states’ occupation/industry structure affects this ratio. The statewide results from the 2011 ACS are shown in Table 2.
Michigan’s manufacturing legacy results in one of the lowest ratios among the states - 74.2 percent. This places us in a tie with Alabama for 43rd place. Nevada, with its troubled service-based industry mix has the highest ratio – 86.5 percent, while Wyoming comes in last at 66.1 percent.
The final characteristics that we will look at in this article (the depths of ACS will be explored further in future articles which will delve into other characteristics at the state level and the trends for our larger counties and cities) is educational attainment. A number of studies have tracked the decreasing per capita income in Michigan that has occurred with the implosion of manufacturing – particularly the automotive industry. The loss of high wage/low education jobs has clearly pointed out the necessity for Michigan to increase the educational attainment of its residents.
In order to do this, we must increase the share of our youth graduating from high school and moving on to post-secondary education. Once they have completed that education, we must retain them in Michigan. Retention of our college graduates is a must for our future, as is our ability to attract college-educated residents from other states and from overseas. We are one of the top states for college attendance of foreign students. We must do a better job of keeping them here after graduation.
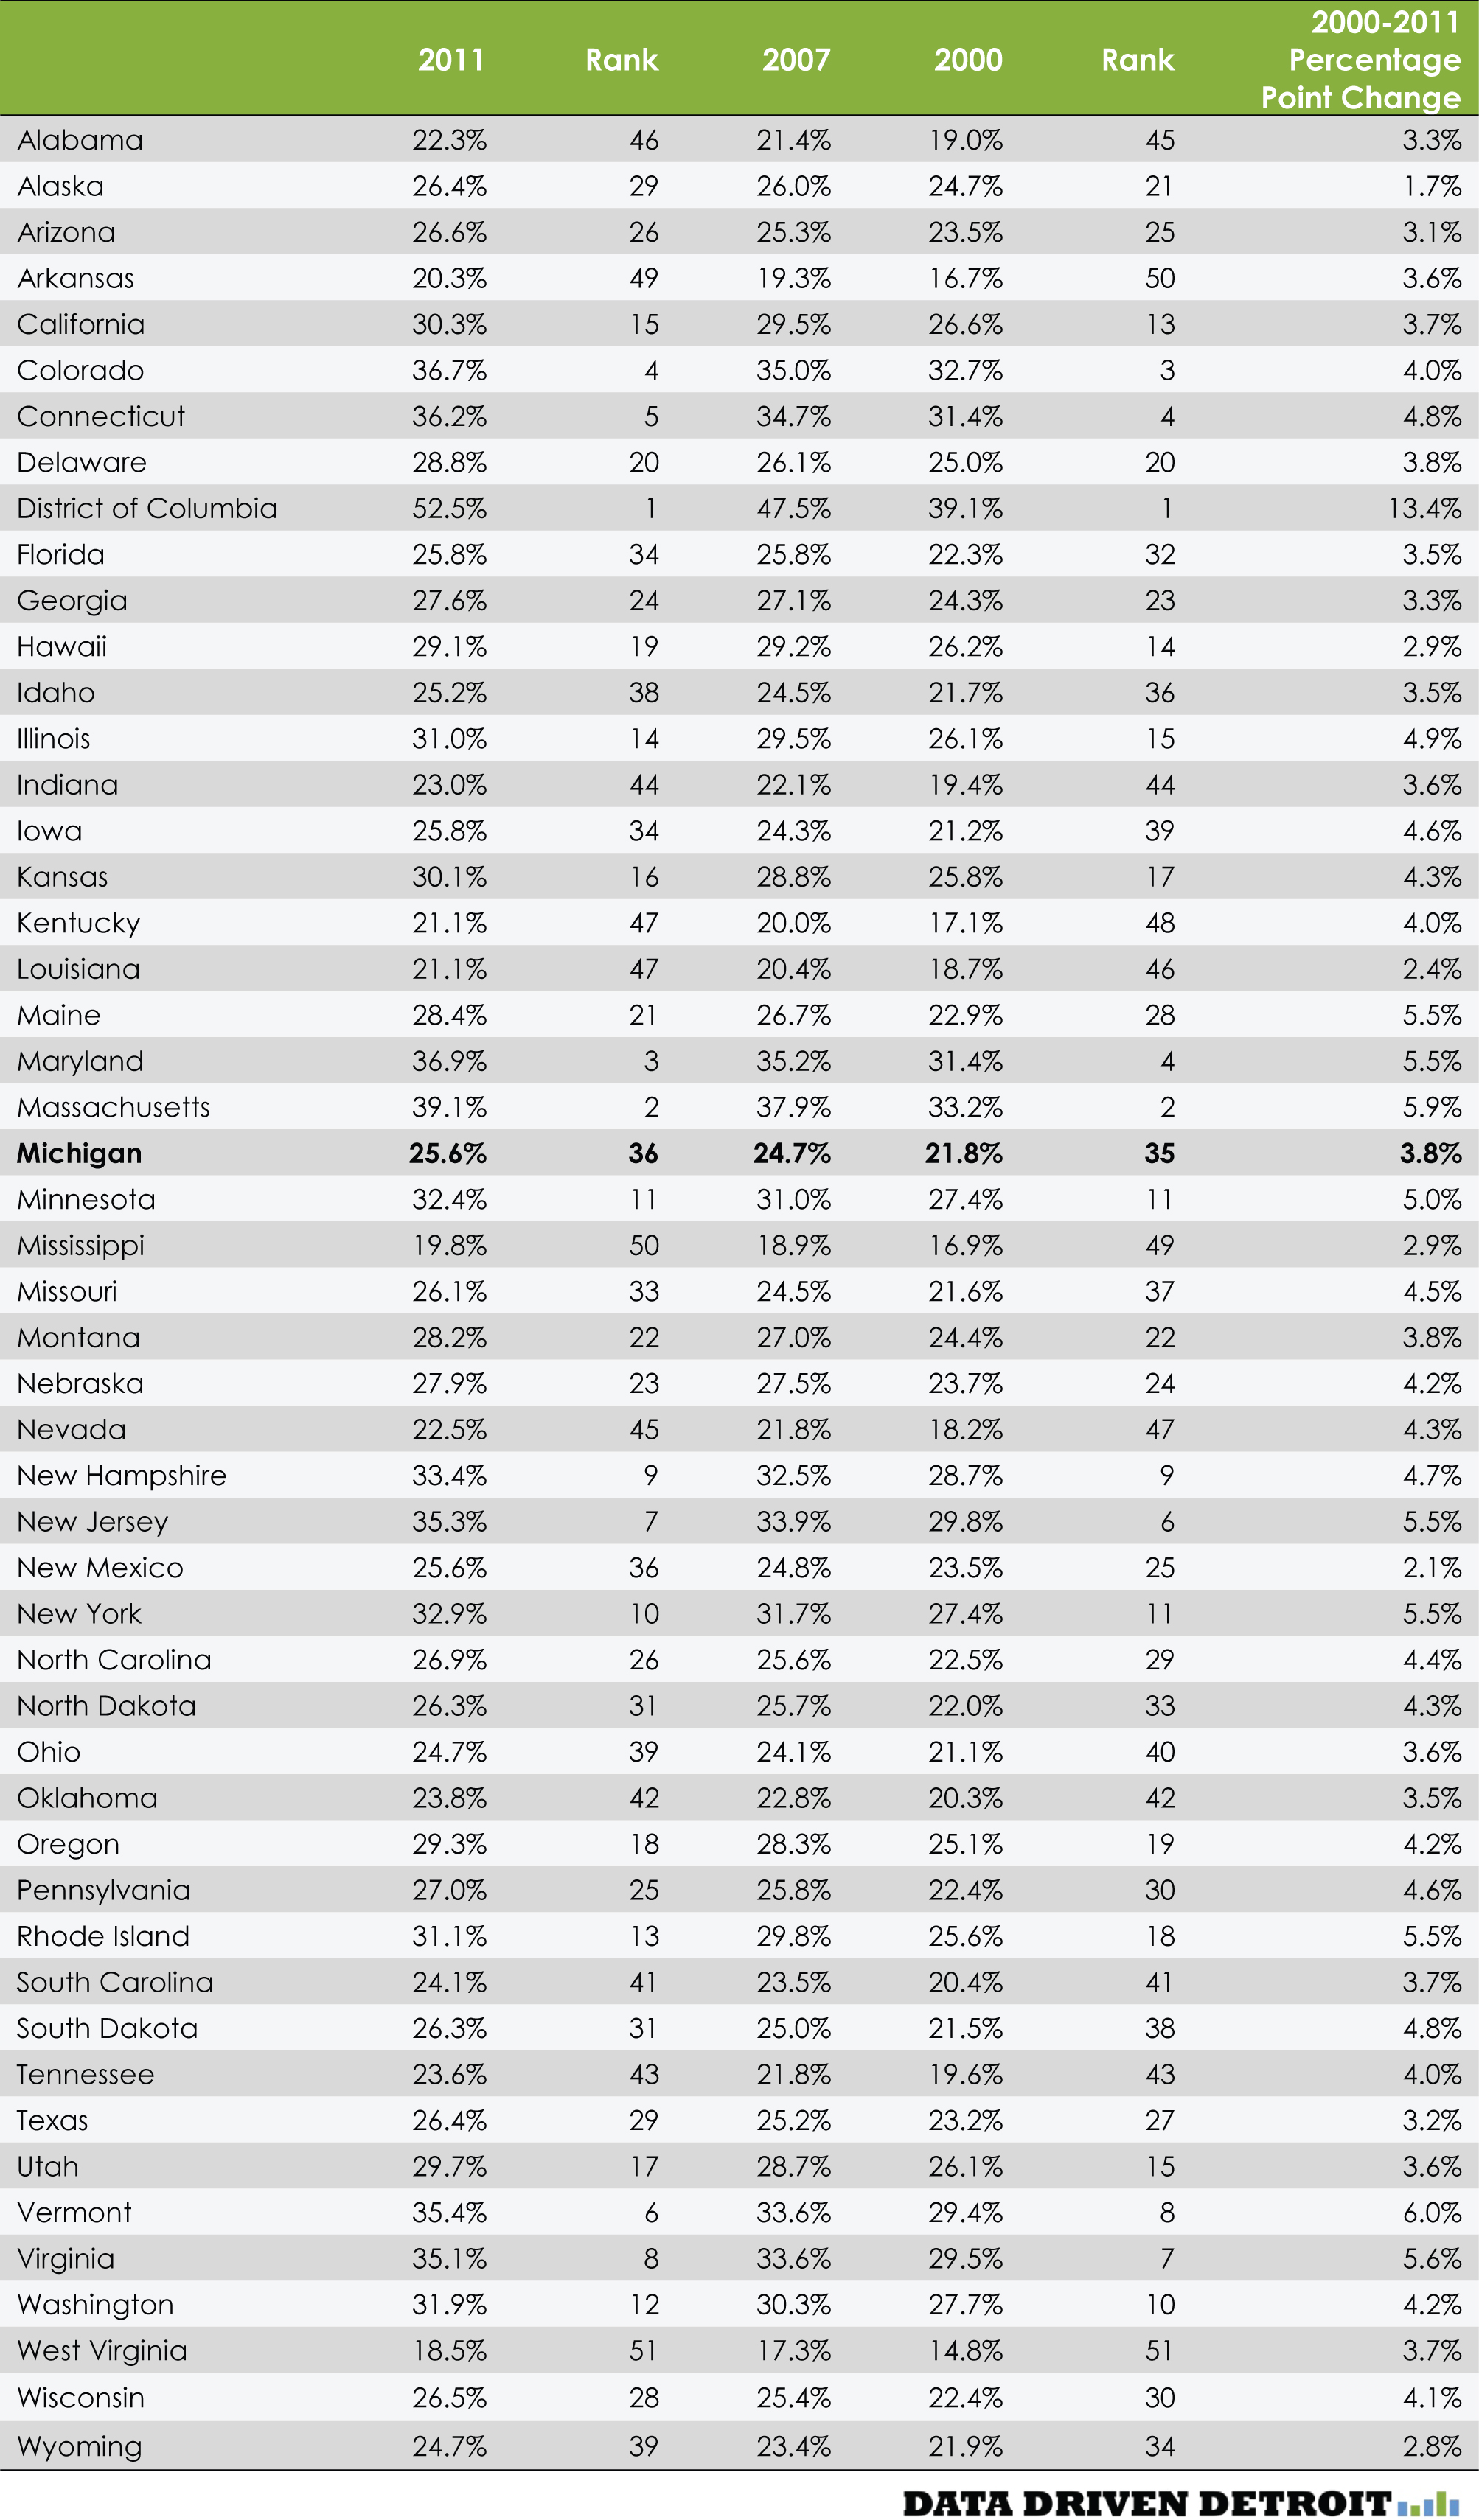
The 2011 ACS shows that 25.6 percent of our population 25 years and over has at least a bachelor’s degree. This is up from 25.2 percent in 2007 and 21.8 percent in 2000. While we applaud the increase, we must recognize that it is not fast enough. If you look at Table 3, you will see that our increase did not keep up with our competitors and we actual fell one more spot in the rankings to 36th. The District of Columbia and Massachusetts maintained their 1st and 2nd place rankings, while West Virginia held on to 51st place. We must be concerned by the fact that the distance between Michigan and West Virginia is much less than that between Michigan and Massachusetts (D.C. is an unusual case).
While our median household income ranking was better than that using per capita personal income for comparative purposes, the message is still the same – educational attainment leads to increasing income. We can no longer afford to make baby steps in education or we will continue to fall farther down the income ladder.
Table 2. Male and Female, Full-time, Year-Round Earnings by State, 2011
Business Watch
Covering the intersection of business and policy, and informing Michigan employers and workers on the long road back from coronavirus.
- About Business Watch
- Subscribe
- Share tips and questions with Bridge Business Editor Paula Gardner
Thanks to our Business Watch sponsors.
Support Bridge's nonprofit civic journalism. Donate today.
See what new members are saying about why they donated to Bridge Michigan:
- “In order for this information to be accurate and unbiased it must be underwritten by its readers, not by special interests.” - Larry S.
- “Not many other media sources report on the topics Bridge does.” - Susan B.
- “Your journalism is outstanding and rare these days.” - Mark S.
If you want to ensure the future of nonpartisan, nonprofit Michigan journalism, please become a member today. You, too, will be asked why you donated and maybe we'll feature your quote next time!