The Great Lakes state, graying: Demographic reality hits Michigan
A recent Bridge article describes the unique challenges posed by Michigan’s aging population – in transportation, healthcare, education, and economic development. Alcona County has the state’s highest median age at 56.9, joined by 12 other counties with a median age of 50 years or more, and five more over 49 years of age. Five of the 13 are in the Upper Peninsula, with eight are in the northern Lower Peninsula.
I have been studying and writing about Michigan’s demographics for many years, and this article moved me to look further into county population changes across the state. Population changes, at any geographic level, are the result of two major phenomena:
Natural increase, or the difference between the number of births in an area and the number of deaths.
Net migration, or the difference between the number of people moving into an area and the number moving out. Migration is broken into two categories – immigration from other countries, and domestic migration, or those who move from elsewhere in the U.S. (or within the state).
So let’s look at the numbers and see what patterns we can discern across the state. The source of our data is the 2014 county population estimates released by the Census Bureau on last month.
Population change, 2010-2014
Between 2010 and 2014, 57 of Michigan’s 83 counties lost population. While the losses are concentrated in the Upper and northern Lower peninsulas, clear patterns of loss also followed the Lake Huron shoreline and the southern tier of counties abutting Ohio and Indiana.
Wayne County led all counties in Michigan, and the country, with a loss of 55,780 residents. Genesee followed with a loss of 12,895, and Saginaw, St. Clair and Monroe comprised the remainder of the bottom five. Oakland County led all gainers with an increase of 35,506 residents. Kent followed with a gain of 26,615, and Macomb, Ottawa and Washtenaw rounded out the top 5.
Now that we have a picture of the overall population trends, let’s look at the components of change to understand the role that each played.
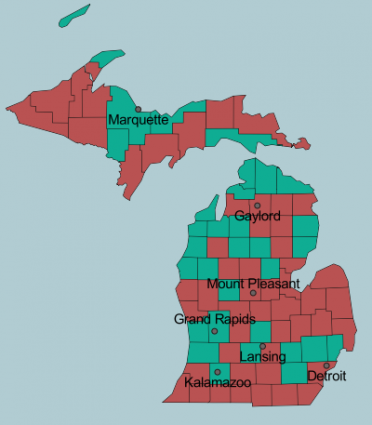
Natural increase, 2010-2014
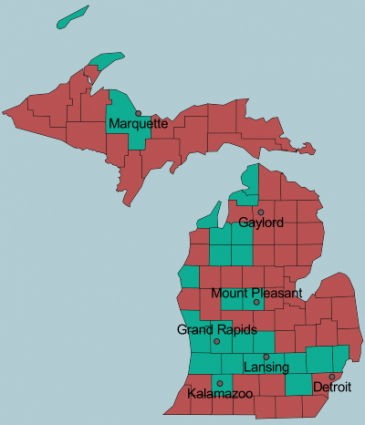
Overall population, 2010-14
Most counties have lost population since the last Census but three of the four most populous -- Oakland, Macomb and Kent, have grown, as has the state overall.
[/caption]The data show that 41 counties experienced more deaths than births between 2010 and 2014. Putting a picture to the Bridge article, our second map shows this phenomenon occurring in all but three U.P. counties – the university-based counties of Houghton and Marquette, and Chippewa County. In each case, the birth advantage was very small. The few net increase counties in the northern Lower Peninsula also tended to have small birth advantages, with the exception of the strong tourist county of Grand Traverse. The entire southern third of Michigan counties, with the exception of Cass, showed a pattern of natural increase.
Net migration, 2010-2014
Our third map looks at net migration by county. As stated earlier, the immigration component of migration is always positive. However, outside of the somewhat rural counties with universities – Houghton, Marquette, and Isabella – immigration is concentrated in the urban counties to the south.
The pattern that one sees in the net migration map is really no pattern at all. What becomes clear is that natural increase or decrease is the force that is driving population change in the northern two thirds of the state. This is why the graying of the population is such an important story. As the population continues to age, the number of deaths will continue to increase while births continue to decrease. Since migration will never make up the difference, the forecast is one of continuing population loss for most of the region.
The bottom third of the state is a mixed bag to say the least. Again, natural increase is the primary component driving population change. However, the counties that are also adding migrants will prove to be the big winners over time. While the major metropolitan counties that contain major cities are all adding immigrants, the ones growing fastest are those that are also drawing domestic migrants from outside and within the state.
Net migration, 2010-14
Much of the state is still losing population to other counties or to other states, with Wayne County continuing to see residents move to neighboring Macomb and Oakland counties.[/caption]
Unfortunately, Michigan is not a strong attractor of residents from other states (in fact it is a consistent out-migrant state), and thus the counties that are winners in domestic migration tend to be attracting them from neighboring counties.
What does it all mean?
In 2000, Michigan was the 22nd youngest state in the country based on the median age of its population – 35.5 years. Florida's median age was 3.2 years higher. In 2013, Michigan was the 42nd youngest population with a median age of 39.6 years. Florida is now only 1.9 years higher.
Michigan ranked fourth, behind Maine, New Hampshire and Vermont, in its rate of aging between 2000 and 2013 – both in numerical and percentage increase.
While I love Baby Boomers as much as the next guy, we are really only serving as the "new face" of retirement and health care. Michigan must start appealing to youth at rates far higher than what downtown Detroit and Grand Rapids can handle. While I doubt that two-thirds of our state will bring much to the table in that regard, we have a number of communities across our metropolitan areas that can, if they, supported by legislation and programming, follow the known best practices.
We know what we need to do to attract the young. The question is, do we have the political will to make it happen?
See what new members are saying about why they donated to Bridge Michigan:
- “In order for this information to be accurate and unbiased it must be underwritten by its readers, not by special interests.” - Larry S.
- “Not many other media sources report on the topics Bridge does.” - Susan B.
- “Your journalism is outstanding and rare these days.” - Mark S.
If you want to ensure the future of nonpartisan, nonprofit Michigan journalism, please become a member today. You, too, will be asked why you donated and maybe we'll feature your quote next time!