INTERACTIVE MAP: Where Detroit is focusing on blight
Which Detroit neighborhoods are first in line for home demolition
Detroit leaders are using $50 million from the federal government to demolish thousands of buildings across the city, part of a multi-pronged attack on blight. In doing so, the Detroit Land Bank Authority is focusing on specific neighborhoods, knocking down houses, citing owners for vacant buildings and auctioning off the best that have fallen into city ownership.
You can see those zones highlighted in green. The darker the zone, the more demolitions that are taking place there. Zoom in to see where the city has done the most work. As you get to the street level, red dots represent buildings either demolished or in the process; green represent different stages of auction.
demolitions
- 100
- 100-199
- 200-299
- 300-399
- More than 400
- In 2nd
funding wave
Source: Detroit Land Bank Authority
Other views of the city
As the maps below show, the Detroit neighborhoods being targeted for home demolitions tend to be those that are more densely populated. The targeted neighborhoods also tend to have higher-income residents, higher rates of home ownership and fewer vacant homes. The city contends that attacking blight in these stable areas will help keep more residents from fleeing Detroit. (The black lines on each map indicate neighborhoods getting priority for blight removal). Data comes from the 2010 decennial census and the 2009-2013 American Community Survey.
Density
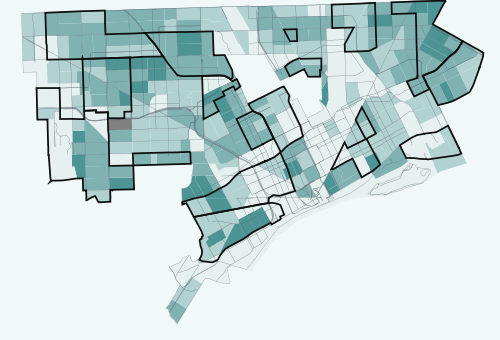 Detroit density
- 0 -
3,477 - 3,478-
5,922 - 5,923-
8,420 - 8,421-
14,871
Home ownership
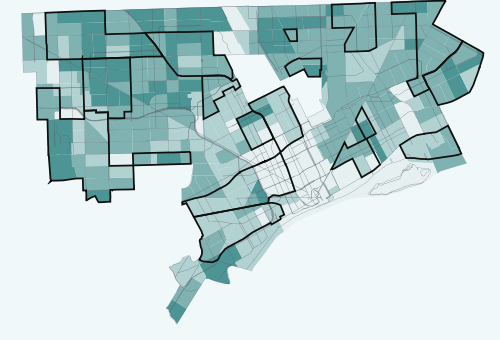 Owner-occupancy rate
- less than
28.1% - 28.1 -
49.3% - 49.3 -
65.3% - more than
65.3%
Income
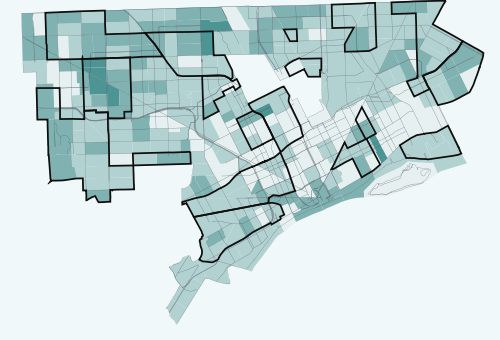 Median household income
- less than
$19,259 - $19,259 -
$30,190 - $30,190 -
$50,088 - $50,088 -
$100,000
Vacancy
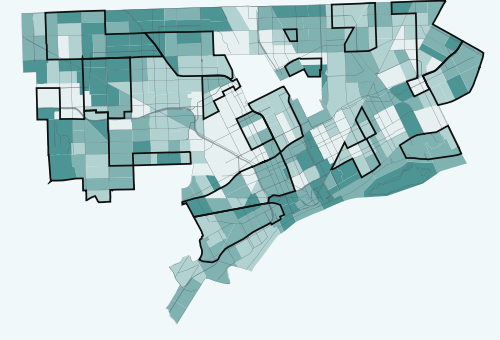 Vacancy rate
- 41 -
63.4% - 30 -
40.9% - 18.5 -
29.9% - less than
18.5%
See what new members are saying about why they donated to Bridge Michigan:
- “In order for this information to be accurate and unbiased it must be underwritten by its readers, not by special interests.” - Larry S.
- “Not many other media sources report on the topics Bridge does.” - Susan B.
- “Your journalism is outstanding and rare these days.” - Mark S.
If you want to ensure the future of nonpartisan, nonprofit Michigan journalism, please become a member today. You, too, will be asked why you donated and maybe we'll feature your quote next time!