Michigan bucks trend – in good way – on family incomes
Michigan finally bucked a national trend in a positive direction as median household income rose while the national median was falling last year. More about that after the national news.
Fall is almost here and the time has come for the Census Bureau to release its latest analyses of the economic health of the country and its communities. The flow began Sept. 12 with the release of its national report on income, poverty and health insurance coverage.
Here are the highlights that I take away from the report:

* Real median household income in the U.S. fell 1.5 percent between 2010 and 2011, coming in at $50,054. This marked the second consecutive annual decline. Median family income dropped by 1.7 percent.
* About 46.2 million people, or 15 percent of the total, had income below the poverty line. (The poverty rate in 2011 for a family of four was $23,021.) Both the number and rate were unchanged since 2010, following three consecutive years of increase -- a finding that surprised the experts.
* The number of people without health insurance declined from 50 million to 48.6 million, and the uninsured rate fell from 16.3 percent to 15.7 percent.
* The number of persons working full-time, year-round increased for both men and women.
* Women working full-time, year-round averaged about 77 cents on the dollar, compared to their male counterparts (not weighted for occupation or experience). This ratio has held steady for the last eight years.
* There are a couple of findings in this report that I feel need to be brought forward in a little more detail. These are the income trends tied to race/ethnicity and income inequality:
Race/ethnicity
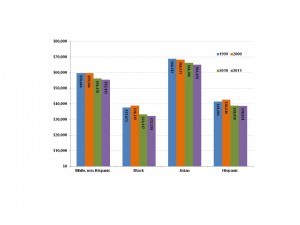
While the year-to-year numbers showed that income fell for non-Hispanic whites and African Americans, while holding steady for Hispanics and Asians, the details show a growing racial gap that must be addressed. It is one thing to look at the change from 2010 to 2011, but it is more instructive to go back to a time of economic strength to see how the groups have fared.
Figure 1 takes us back to the 1999-2000 period when median household income was at its highest across the nation, in Michigan and for each of our race/ethnic groups. While African-American households reached their highest median income since the Census Bureau began tracking in 1967, there was still an obvious gap with the other groups. Their income ratio to others was: White, non-Hispanics (65 percent), Asians (57 percent) and Latinos (91 percent). Over the last 11 years, however, African-American households have fared much worse than the other groups.
While all groups have experienced a decrease in real median income, the loss for African Americans (14.5 percent) has more than doubled that of the others. This has resulted in an increasing gap across the board, with ratios in 2011 of: White, non-Hispanics (58.2 percent), Asians (49.5 percent) and Latinos (83.4 percdent).
Income inequality
Income inequality increased by 1.6 percent, the biggest one-year increase in almost two decades, suggesting that a trend in place since the late 1970s was picking up steam. For many economists, the most troubling statistics were those on income inequality underscoring the middle-class squeeze. The 60 percent of households earning between roughly $20,000 and $101,000 collectively earned 46.6 percent of all income, a 1.5 percent drop. In 1990, they shared more than 50 percent of income.
It appears that the working class, whose pay tops out about $62,000, are bearing the brunt of the income squeeze, with dropping pay rates, decreasing hours worked, and dropping home values.
In contrast, the top fifth rose 1.6 percent in 2011 after several years of decline during the recession. The biggest gains went to the top 5 percent, who earn more than $186,000; their share of income jumped almost 5 percent in a single year.
Good news for Michigan
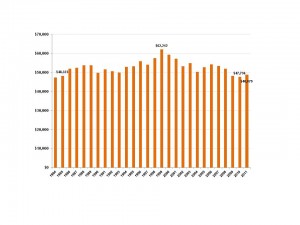
As I stated at the beginning of this article, Michigan residents weathered the storm on 2010-11 and experienced an increase in their median household income. Perhaps the old adage that we have been down so long that one has to go up eventually is at play. Michigan's real median household income increased 2.4 percent, from $47,736 in 2010 to $48,879 in 2011.
While still below the national median, Michigan closed the gap from a ratio of 93.9 percent to 97.7 percent. Figure 2 shows Michigan's median household income since 1984.
It is clear that, while we experienced a long-awaited increase in income over the last year, we remain well below (down 21.4 percent) the median we reached in the heady economic days of 1999. In fact, our 2011 income was just above what we were making as a state back in 1985.
While the latest report delves deeply into the national picture, it only provides state level totals. As a result, we have no information to help us understand the dynamics behind the increase. We don't know the components of that change either by race/ethnicity, age, gender or geographic area. That lack of information will change later this week, however, when the Census Bureau releases the latest information from the 2011 American Community Survey (ACS). These data will not only dig into details at the state level, but we will receive new data for all counties and municipalities of 65,000 population or more.
For now we are left to pontificate. The obvious response is the reviving health of our auto industry that has resulted in increasing employment in manufacturing. We have also watched our unemployment rate decrease over the period, driven by both increased employment and decreasing labor force participation rates. But one is still left to wonder how the national trends around race, gender and inequality have played out in Michigan. How have our various regions (rural and urban), central cities, and suburbs faired? Stay tuned.
Finally, we take a quick look at the state level poverty summary provided in this report. (A detailed analysis from ACS will be even more important as we try to understand the poverty dynamics across the state.)
| Table 1: Michigan Residents in Poverty, 1999-2011 Year # in poverty |
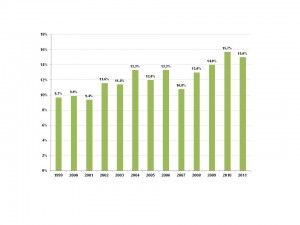
Figure 3 shows the trend in percent of Michigan's population in poverty from 1999 (the "good old days") and 2011. Table 1 provides the numbers behind the percentages.
While the 2011 figure of 15 percent represented an improvement since 2010, it still represented the second-highest share we have experienced since 1999. Table 1 translates the percentages to real people.
Almost 1.5 million Michigan residents live in poverty. While representing a decrease of almost 80,000 over the last year, it is still a half million more than we had during the 1999-2001 period. While not reported here, last year's ACS results made it quite clear that a large segment of Michigan residents are surviving with incomes just over the poverty threshold -- within 125 percent and 150 percent. When it comes to paying the increasing costs of food, fuel and other necessities, these statistics truly tell the picture of need. We look to ACS 2011 to help us round out this picture as well.
The bottom line is: Let's celebrate the findings as a hopeful sign of things to come. Remember, however, that one year does not make a trend and that we have a long way to go to bring our state and its residents back to "prosperity."
Business Watch
Covering the intersection of business and policy, and informing Michigan employers and workers on the long road back from coronavirus.
- About Business Watch
- Subscribe
- Share tips and questions with Bridge Business Editor Paula Gardner
Thanks to our Business Watch sponsors.
Support Bridge's nonprofit civic journalism. Donate today.
See what new members are saying about why they donated to Bridge Michigan:
- “In order for this information to be accurate and unbiased it must be underwritten by its readers, not by special interests.” - Larry S.
- “Not many other media sources report on the topics Bridge does.” - Susan B.
- “Your journalism is outstanding and rare these days.” - Mark S.
If you want to ensure the future of nonpartisan, nonprofit Michigan journalism, please become a member today. You, too, will be asked why you donated and maybe we'll feature your quote next time!